• About
    • About the FIA
    • Priorities
    • Our Team
    • Brainstorming Board
    • Partners and Affiliates
    • Contact Us
  • News + Events
    • News
    • Events
    • Videos
    • Newsletters
    • @FIAumd
    • In the Media
  • Spark Grants
    • Spark Grants Overview
    • Spark Grants FAQ
    • 2012-2015 Seed Grants
    • 2012-2015 Seed Grant Winners
  • Special Topics
    • SearchReSearch
    • Curated Topics
FIA

SearchReSearch

Answer: What’s a large US city with very low population density?

Dan Russell • August 3, 2022
 SearchReSearch
Republished with permission from SearchReSearch
Answer: What’s a large US city with very low population density? Dan Russell

Let's work backwards...


... and answer the last SRS Challenge first... you remember, the one about finding the largest US city with a very low population density!

I'll answer the previous Challenge ("rusty thing I found in the woods") before next week and get us back on track.

If you recall, our Challenge was: "what large US city has the lowest population density as of 2020?"

There are tables one can find that will tell you one answer, but I'd like you to solve this Challenge in a more direct way--a way that will teach you how to download data directly into a table and then manipulate it yourself.

Can you do this hands-on data manipulation Challenge?

Here's what I want you to do:

1. Search for a table of the largest US cities by population. You'll want to find a table with at least 330 entires in it.

2. Download that table into a spreadsheet.

3. Compute the population density (if you need to... it might be a column in the data set).

4. Sort the table by density, and then tell us what the city name is!

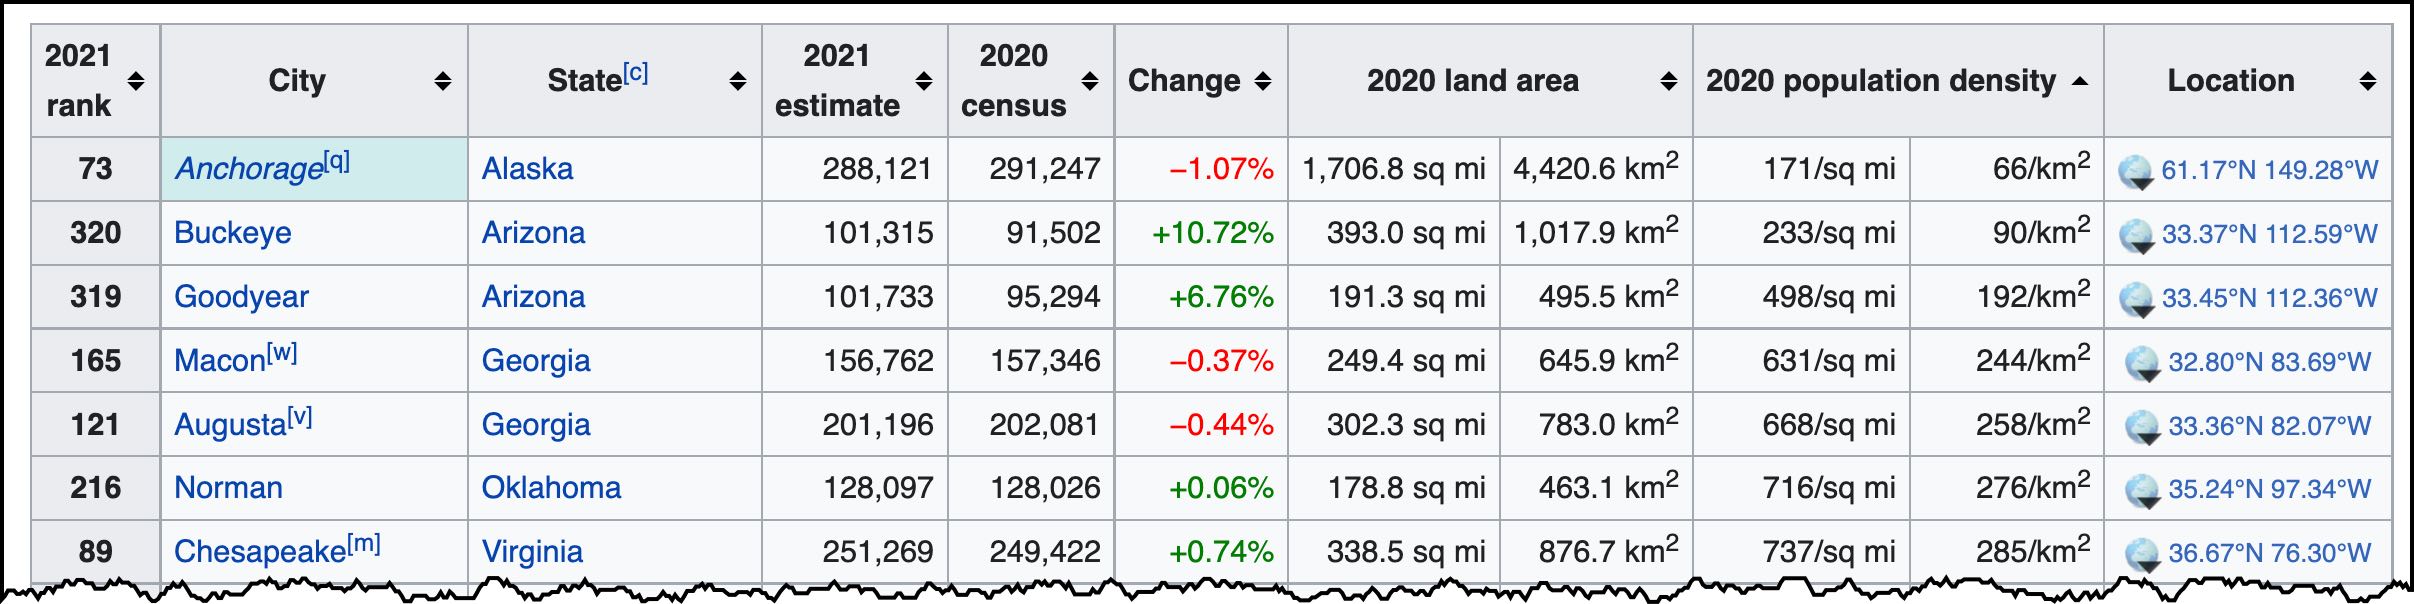
Your table should look like the one above (hint: I got it from Wikipedia, but you can find your own source if you'd like--the diversity of data sources might be interesting).

Here's what I did...

First search for the Wikipedia table. My query was:

[ wikipedia table largest US cities population ]

which led me to the Wikipedia table List of US cities by population. It's a classic Wikipedia entry with all the standard data disclaimers and information (e.g., This table lists the 331 incorporated places in the United States (excluding the U.S. territories) with a population of at least 100,000 on July 1, 2021, as estimated by the United States Census Bureau. The table displays: (a) The city rank by population as of July 1, 2021, as estimated by the United States Census Bureau, (b) The city name, etc etc etc.)

If you look carefully, you'll see that the columns can be sorted by clicking on the sorting widget at the top of each column in the table. (You need to recognize that that's what these widgets do--it's part of your SRS visual literacy: recognize and understand what UI widgets are and what they do.)


If you click on that widget, you can sort by population density:


And voila, you've got the answer. That's the fast and easy way to get to the answer.

BUT... the point of the Challenge is to get you to figure out how to download this table and then manipulate it to get to the same answer. (That is, the pedagogical point of this Challenge is to learn how to download data tables from the web and then how to work with them.)

Do you know how to pull data tables off the internet and into your favorite spreadsheet?

Well, the obvious SRS way to find out is with a search:

[ how to import data tables into Google sheets ]

which will lead you to a number of sources, including this well-written and extensive post by Parul Pandey about Importing HTML tables into Google Sheets or this YouTube video from Teacher's Tech about How to Import Data from Webpages into Google Sheets. These are excellent resources, and for full details about how to do this, I recommend those page.

For our purposes, I'll cut to the chase and point you to my Google Sheet with the population data in it. This sheet looks like this:

There are a couple of things to note here. First, cell A1 has the magic function in it:

=ImportHTML (URL, "table", 5)

which says to import the 5th table of that web page (the Wikipedia link) into the sheet as a table. I had to experiment a little to figure out that it was the 5th table, but I guessed it was #5 on the second try. It's easy to just keep trying until you get the right table. (Look at the Wiki page and count down from the top of the page.)

This imports the 5th table into that location. If you look back and forth, you'll see it's a complete copy of that data table.

That's pretty straight forward.


Next thing to notice: I put that table into Tab 1 of the sheet ("Datatable import"), and then did all my manipulations on a COPY of the sheet that I made in Tab 2. If you look at Tab 2 ("Cleanedup data"), you'll see that it's where I did my cleaning up. This is a good practice to follow--don't muck up your original data set as you're exploring.

Note that when the data is imported, it's often imported as TEXT data, and perhaps not the numeric data you're seeking.

In particular, column J is the 2020 population density in people/km2, and it's a text field, not a number. So I initially wrote this formula to extract the number from column J.


And that LOOKS right. But as we know, appearances can be deceiving. I thought it was right, but when I sorted the column, I noticed that the sequence was bizarre. I saw patterns in the data that looked like this:


... which is clearly very wrong. The problem is that column O is all TEXT... and sorting text like this gives you a sort where 7,681 precedes 706.

Once I realized that, I fixed up the extraction formula to give a real numeric value. This is that formula (with the extra =value(...) in it):


NOW I can sort by Column L ("Density Value") and see the right names of cities appear at the top:


So... there's a quick and easy way (just use the built-in sort on the Wikipedia page), and also a more sophisticated way to download the data to your own sheet. Of course, this then allows you to do more things with it--say, create a chart like this:


SearchResearch Lessons


Two key points from today.

1. Use the ImportHTML function to pull data tables from web pages into Sheets. Incredibly handy when you need to get your hands on the actual data.

2. ALWAYS check that your data is what you think it is. In this story, I mistook what LOOKED like numeric data for numbers, but noticed that the sort order was all messed up. When I converted those text numbers to actual numbers, sorting suddenly started working.

I guess the summary is, as always, pay attention to what you're doing. Keep asking yourself, does this make sense? And when it doesn't, dive into full-on SRS mode and figure out what's happening.

Search on!


P.S. Fairness requires that I point out that Microsoft Excel has a VERY nice import data function built into it. It even lets you browse through the tables in the source web page rather than trying to figure out the number of the table to import. See Importing Data into Excel from the Web. It's actually very handy.

Share

Comments

This post was republished. Comments can be viewed and shared via the original site.
2 comments

About the Author

Dan RussellDan Russell

I study the way people search and research. I guess that makes me an anthropologist of search. While I work at Google, my blog and G+ posts reflects my own thoughts and not those of my employer. I am FIA's Future-ist in Residence. More »

Recent News

  • Deepfakes and the Future of Facts
    Deepfakes and the Future of FactsSeptember 27, 2019
  • Book cover for Joy of Search by Daniel M. Russell
    The Joy of Search: A Google Insider’s Guide to Going Beyond the BasicsSeptember 26, 2019
  • The Future of Facts in a ‘Post-Truth’ World
    The Future of Facts in a ‘Post-Truth’ WorldMay 15, 2018
  • The Future of Virtual and Augmented Reality and Immersive Storytelling
    The Future of Virtual and Augmented Reality and Immersive StorytellingJune 6, 2017

More »

Upcoming Events

There are no upcoming events scheduled. Please check back later.
Event Archive »
Video Archive »

Join Email List

SearchReSearch

  • Answer: What do these everyday symbols mean?
    Answer: What do these everyday symbols mean?March 15, 2023
  • SearchResearch Challenge (3/8/23): What do these everyday symbols mean?
    SearchResearch Challenge (3/8/23): What do these everyday symbols mean?March 8, 2023
  • PSA:  Read Clive Thompson’s article about how he does research
    PSA: Read Clive Thompson’s article about how he does researchMarch 3, 2023
  • Answer: World’s largest waterfall?
    Answer: World’s largest waterfall?March 2, 2023

More »

University of Maryland logo
Robert W. Deutsch Foundation logo
Google logo
Barrie School
Library of Congress logo
State of Maryland logo
National Archives logo
National Geographic Society logo
National Park Service logo
Newseum logo
Sesame Workshop logo
Smithsonian logo
WAMU
© 2023 The Future of Information Alliance, University of Maryland | Privacy Policy | Web Accessibility