Gratefully, the wildfires are out …
… It’s been a wild summer of fire in California.
As you recall from the Challenge of November 14, 2018 I posed the SRS Challenge “How many wildfires have there been in California over the past 20 years?”
Regular Reader Ramón asked this question, and it turned out to be a really relevant question.
1. How has the number of wildfires changed over the years in California? Where there more (or fewer) in the past than is taking place now?
I suspected that the only way to answer this is to find an authoritative data base of California wildfires. I started my research with:
[ database California wildfires ]
which gave me this SERP:
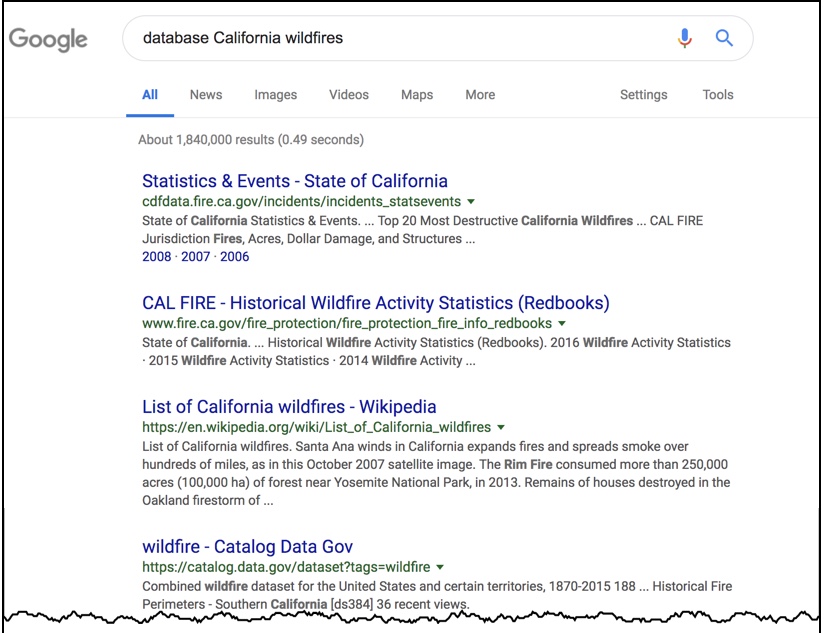
The first hit is the “statistics and events” data from CDFData.Fire.ca.gov Sure enough–that’s pretty authoritative.
If you visit that page, you’ll learn that the statewide fire organization is CALFIRE. Their page looks like this:

As you see, it has data going back to 1999 (not quite 20 years, but close enough for our purposes).
If you look farther down the SERP results list, you’ll see a lot of articles about “California’s Most Destructive Wildfires” or “The Deadliest Fires in California’s History.” We don’t want those, we want ALL of the wildfires. So we really want data tables (with good definitions about what constitutes a wildfire — is a 1 acre grassfire really a “wildfire”?).
So I’m willing to go with the CALFIRE data sets. A few clicks down and you land on their accumulated data tables called “Redbooks.”

These are great resources, but also somewhat dense and FULL of data tables. That’s great (if you’re doing a report on how fires operate in California), but you have to be very careful when you’re pulling data, as we’re trying to do here.
But I know that some research tasks take time, so I started in, one report after another.
After about 20 minutes of this, I thought that maybe there’s another way to get this data. So I did another search:
[ Wikipedia CALFIRE wildfire data ]
and discovered that someone had already compiled all of the data from the CALFIRE documents! Win! In particular, the section named “Post-2000” has all of the data from the CALFIRE Redbooks. Finding that saved me a bunch of time.
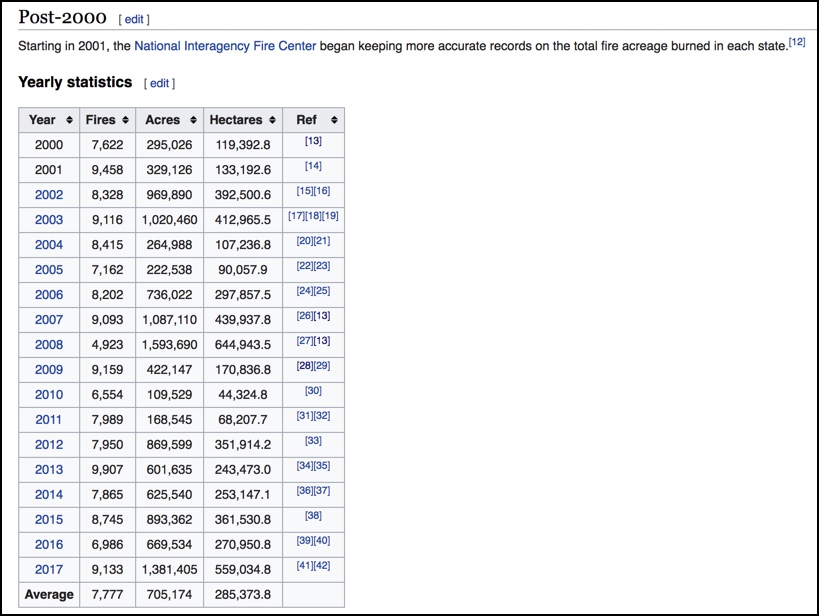 |
| Wikipedia section on California wildfires that compile all of the data by year since 2000. |
It’s pretty easy to copy that data out and drop it into a spreadsheet and create these charts. Note that these are both from the CALFIRE data (as reflected in the Wikipedia page).
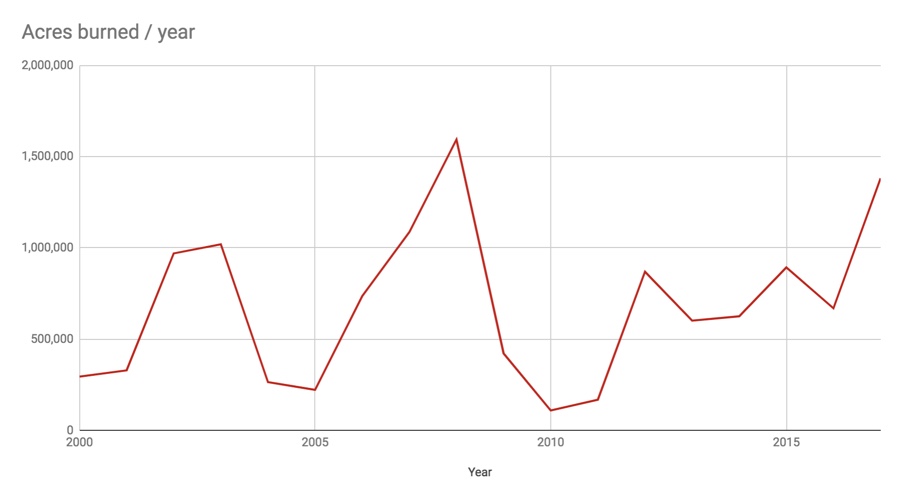

Note that 2008 was a strange year: Fewer fires than average, but more acres burned. Is that data correct? Or is it just a fluke? Well, we have the link to the Redbooks, let’s see what they say.
I checked the 2008 Redbook, and the data in the chart above is correct. (This isn’t surprising, all of the data is coming from the same source–CALFIRE.)
In the data sets, I noticed that Axios had pulled all of the wildfire data larger than 300 acres. Just to see the difference, I plotted that same data on a different tab of the spreadsheet. Those charts look like this:


(Link to my spreadsheet, which has a comment in cell A1 for each tab describing where the data came from.)
The total acreage burned looks pretty much the same (compare the two red lines above), but the NUMBER of fires looks a bit different… especially in 2008. If you look at the top blue line, it seems as though there were fewer fires in 2008 than in other years. But if you drop all of the “little fires” (that is, < 300 acres), you’ll see that the number of fires is fairly high in 2008.
What’s going on here?
It certainly looks like the big fires were bigger, and that’s what drove the total acres burned to be so high.
So, how is this year looking by comparison? I repeated my search from above, but added 2018 to the query.
Obviously, the year hasn’t ended yet, but given the amount of rain California has received in the past few weeks (129% of normal to date in the southern Sierras), the fire season is mostly over.
In particular, I found a web page on the CalMatters.org site that tracks state wildfires. They have this beautiful chart which is consistent with our charts above (makes sense, they’re both draw from CALFIRE data), but it pulled the latest acreage reports from the 2018 Redbooks.
 |
| Total acres burned / year from 1992 until the end of 2018. P/C CallMatters.org |
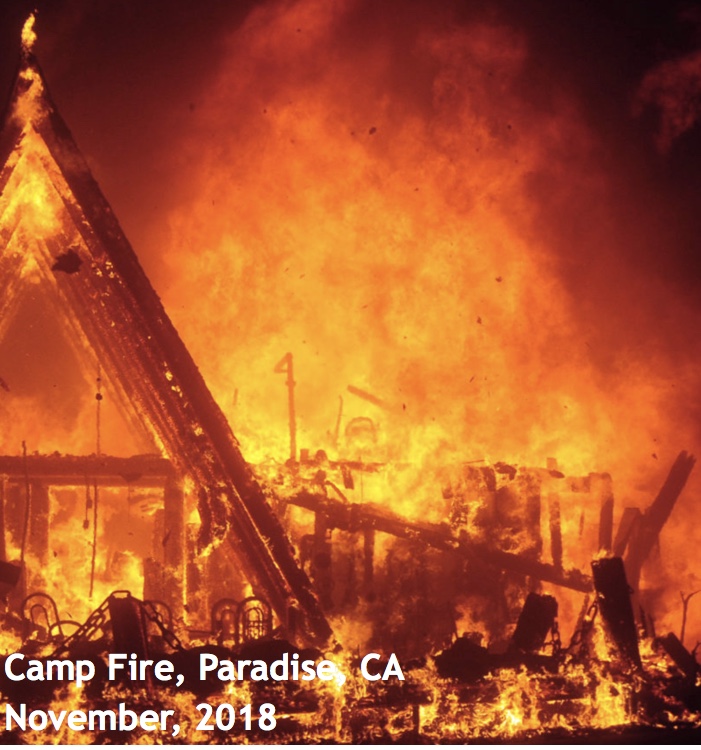
As you can see from this chart, 2018 looks to be just slightly larger than 2008 in total acreage burned. On the other hand, this year was particularly destructive in terms of buildings, total cost, and human lives lost. CalMatters also published a chart showing that 2018 was the worst loss of human life in California for the past 25 years, with over 85 deaths, mostly due to the Camp fire in Paradise, CA.
Search Lessons
In some sense, this wasn’t a difficult search (it didn’t take long to find the authoritative CALFIRE data sets in their Redbooks). But it took me a while to pull data from each of them. Luckily, I thought about looking for a site that had already extracted the data from the original source (the Redbooks), and that ended up saving a ton of time.
Important point: I DID spot check the data (I checked four different Redbooks, beginning, a couple in the middle, and near the end) to make sure that the extracted data actually came the Redbook sources. This is a good data practice–you want to be sure there are no duplicates or data from tables in the Redbooks that’s not quite what you thought.
In general, as I was doing this writeup, I found myself eagerly reading stories about wildfire data, and only after pulling the number and comparing them (and then finding them wildly inconsistent with the data I’d already pulled) that’s when I’d discover that the data was for some other kind of event. For example, I was very excited about finding a table with all the data I wanted… except the totals were WAY different than what I found in the Redbooks. After carefully checking the data source, I found it was data for the entire country–not just California, which is what I was seeking.
That experience led me to the most important data-handling lesson…
1. Double and triple check your data sources. Be SURE you know what your data is describing. I’m fairly careful, and I caught myself with data errors at least 5 different times.
A great practice for this kind of data checking is to walk through it with a friend or colleague. Let them look at what you’re doing and double check the data you’re using. Most importantly, have them check the metadata (that is, the information describing the data source).
Practice safe data handling practices at all times. Triple check yourself (and get a friend to help).
Search on!