.. it’s complicated.
More to the point, just figuring out which data sources you can trust for this kind of information is trickier than I would have thought.
I asked you about your intuitions, and before I did any research on this, I wrote down a few of mine:
A. What fraction of people die from car accidents?
B. How many people die from other kinds of accidents?
C. How many people die of different medical conditions?
D. What are the leading causes of death?
My guesses, before having done any research:
A. Car accidents: 15% of total deaths / year
B. Other (non-car) accidents: 5% / year
C. Medical conditions (not including old-age): 50%
D. Leading causes of death (of any or all causes), in order: Accidents; Heart problems; Cancer
Let’s see if we can answer these questions:
1. How many people die (from all causes) each year in the United States?
2. What are the top 5 causes of death in the United States? (As a fraction of the whole.)
As I mentioned, the interesting question is going to be: Where do you get your data from, and why do you believe it’s accurate?
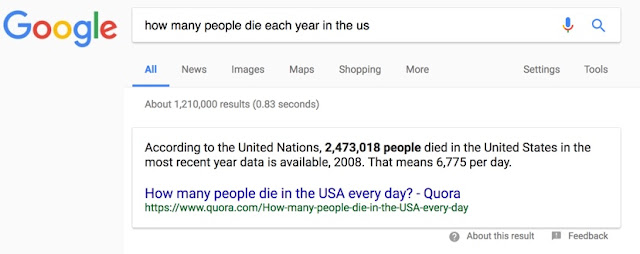
The obvious queries on different search platforms gives different numbers. There’s variation in the answers even within a single search platform. Compare these results with slightly different queries on Google:
 |
| From UN demographics report |
“In 2014, a total of 2,626,418 resident deaths were registered in the United States…”
2014
UNC 2,626,418
CDC 2,626,418
2015
UNC 2,712,630
CDC 2,712,630
 |
| From CDC report, “Chartbook on Long-term Trends in Health” pg. 18 |
Search Lessons
1. When looking at data, be SURE you understand WHEN it was collected and WHAT it’s measuring. As we saw, different sources (Alpha vs. Bing vs. Google) all draw on slightly different resources from different times. This makes a big difference.
2. Consider other factors that might influence your data. In this case, death rates vary a LOT by age. (They vary by other factors too, such as gender, race, and location–but I just focused on age in this post.) Be sure you understand all of the aspects of the data that are important to you.
3. When you need the “next document in the series,” remember that those documents often use boilerplate language, which you can find with a fill-in-the-blank query, like [ “In 2015, a total of * resident deaths” ]. This is an amazingly handy trick to remember.
4. Be sure you know where your data comes from! I naively thought that the UN would have different data than the CDC–but noticing that their numbers are all the same drove me to check where the UN data came from… and it was… the CDC. This data is NOT truly double-sourced!
Search on!
(I’ll post a bit of background about why this one took so long to write up in my next post, later this week. Let’s just say travel go in the way. And… I’ll put out a new Challenge on Monday. Stay tuned!)


