We started last week’s Challenge with two satellite images. The first is from a large center-pivot farm at 29.9653127, 38.3618227 in the northern part of Saudi Arabia.
 |
| Center pivot fields in Saudi Arabia at 29.9653127, 38.3618227 (P/C Google Earth) |
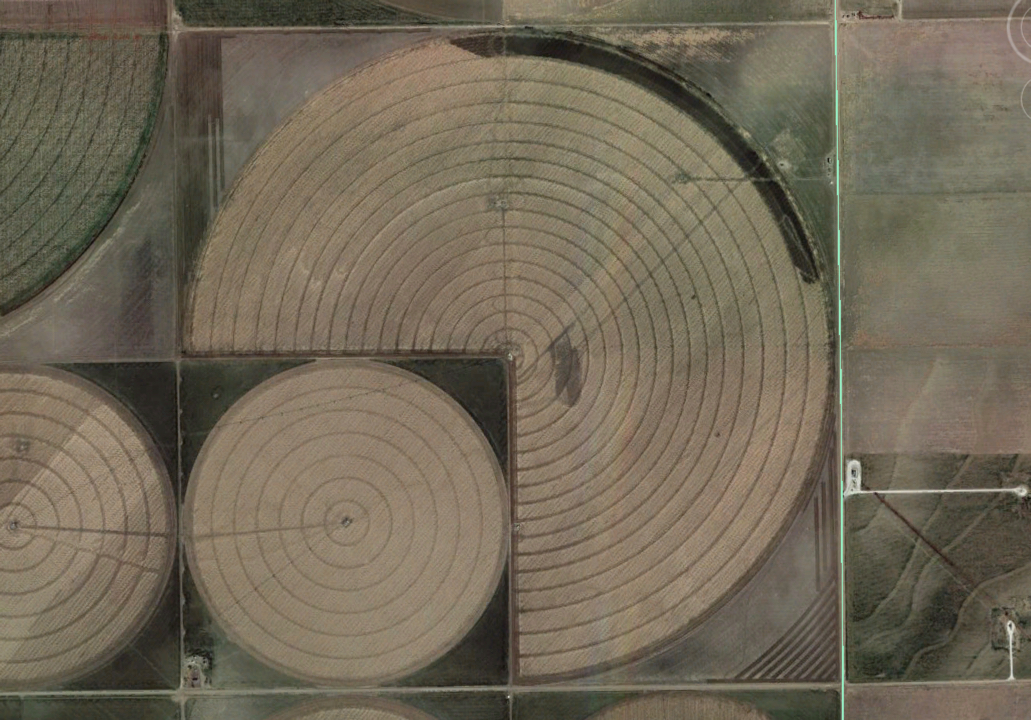
And another image from the middle of the US that also has a lot of center-pivot systems:
 |
| Center pivot fields in the US at 37.4359878,-101.6097197 (P/C Google Earth) |
(Remember that you can click on those images to get the full-resolution image, for close-up viewing or downloading.)
Our Challenges for this week are:
1. (Easy) What’s the most obvious difference between the US and the Saudi center-pivot irrigation systems? (There are a lot of them. Can you list one or two? How did you figure it out?)
There are LOTS of differences, but let’s use Google Earth to do some quick measures. Just how big are these things?

Interestingly, in the US, the circles come in two sizes, large and small. Want to guess what their diameters are?


The smaller one is half the diameter of the larger one, which is why you often see things like this:
We can go on in this vein, but before we tackle the harder problem, let’s look at where both of these center-pivot fields are located:


Both are in fairly flat (easier to build the irrigation systems) and dry (so they really need irrigation) locations. Both happen to be near borders with other states (or countries), and both are near cities and decent transportation systems.
(And, as noted by our regular SRS readers, both places rely on aquifers that are not being replaced; hence both locations are in danger of creating their own localized droughts.)
2. (Hard) How many center-pivot irrigation fields can you count in both of the images shown here? Both images were taken from an altitude of 40 miles–but which location has more of the circular-disk-shaped fields? (You should count but little and big fields.)
I pondered this Challenge for a while before realizing that counting by hand is one solution. And you could do that. But I was thinking about what might be a more general solution… suppose we wanted to count all of the center-pivot irrigation systems in all of Kansas or all of Saudi Arabia? Counting by hand would be a bit tedious and error prone.
What would Dan do? I’d search for a tool to help out.
I did the obvious searches for tools that would search for circles in images, until finally I did this search:
[ tools detecting circles in image ]
This was what I needed… Here’s what I found:

I started reading the first link here about how to detect circles in images by using the Matlab system.
Background: Matlab is a system that lets you do math, graphics, image analysis, and programming all in one package. It’s a product of Mathworks and can be incredibly handy when you have a task that requires you doing some kinds of analysis. I have no affiliation with them–this just happened to be the tool that I found.
As luck would have it, Matlab has a fantastic “try it out for 30 days” evaluation mode. (THANKS, Mathworks! This is awesome!) I definitely wanted to test it out, so I downloaded the package onto my Mac laptop and started following the directions in the article.
The good news is that it works exactly as advertised. (This isn’t always true for articles and systems you read about on the web. It’s to their credit that the stuff actually works as advertised.)
Based on the article, I was able to copy their code and adapt it to our purposes.
This is what Matlab looks like in operation. This is just after I’d run my code (in the center window) and it’s telling me the number of circles it found in the image.

Here’s the way it works: You write a few lines of code (see below), and run it over an image, in our case, the pictures of the Saudi and the US irrigation locations. The code looks at the image and tries to find as many circles in the image as possible.
Here’s the code I used (adapted from the article above):
% read in center-pivot image
US-image = imread(‘CPI-US.jpg’);
% make the image into a “figure” so we can compute on it
figure
% show images as a window
imshow(US-image)
% find small circles with sensitivity = 0.96
[centers, radii] = imfindcircles(US-image,[6 9], ‘ObjectPolarity’,’dark’, ‘Sensitivity’, 0.96)
% show the circles on the window
h = viscircles(centers,radii);
% how many circles did this code find?
length(radii)
What this code does is:
1. read in the image file
2. makes the image visible on my display
3. runs the “imfindcircles” function over the image, looking for circles that are between
6 and 9 pixels wide with a sensitivity factor of 0.96
4. it outputs the center locations AND radii of the circles
5. it draws the circles on the (visible) image
6. the length of the radii is the number of circles it found in the image
The only work I really needed to do was to figure out the size of the circles (in pixels) and then play around with the sensitivity parameter until it found all of the circles that I saw in the image, and didn’t hallucinate anything.
Basically, the ‘Sensitivity’ value tells the program how much to amplify the difference in the colors in the image. If the difference between adjacent pixels is small, it will make that more apparent in the image. It’s a bit like turning up the volume on the ability of the program to make distinctions.
Here are my notes as I was playing with the system. The number (0.99, etc) is the Sensitivity parameter, and the integer next it is the number of circles it found.
0.99 = 3459 (way too many)
0.95 = 172 (missing a lot)
0.97 = 1029 (too many, missing faint ones; missing large circles)
0.96 = 456 (missing some, but pretty close)
To show you what I mean, here’s the circle finder set at 0.99:

And here it is set at 0.90 (which is way too low–it’s missing a lot of circles):

But at 0.96 it finds most of the small circles (it finds 456, while missing a few), but it also misses ALL of the larger circles.
So I re-ran it with the “circle size” parameter set to find circles between 10 and 20:
[centers, radii] = imfindcircles(c2,[10 20],’ObjectPolarity’,’dark’, ‘Sensitivity’, 0.92)
Again, I had to play around with the Sensitivity parameter, and found that 0.92 is about right (for larger circles). If you add the small circles with the large circles, you see 499 circles in the US image. It looks like this:

If you look at this image carefully, you’ll see it’s undercounting by just a bit. (It misses around 20 small circles and 5 large ones.) And if you look at the misses, it’s often because the circle is barely visible. Is it a center-pivot irrigation system that is out-of-operation?
As with many of the Challenges, we have to define our question carefully–and implicitly, what our answer will be as well.
In this case, we’ve used a program to find around 500 center-pivot irrigation systems. With a bit more tuning (and futzing around with the image contrast) we could probably find a few more–but this was about 30 minutes of work on my part, and the accuracy is pretty good.
This becomes ever more evident when you look at the center-pivot farms in Saudi Arabia.
Once more I had to tune the Sensitivity parameter for this image (setting it to 0.99) and found the following:

We’re missing a few (especially at the bottom–fields that are out of commission?), and we seem to be hallucinating a few on the left. Here, the overcount is close to the undercount, so we’ll accept the number of circles found as being close to the actual number–in this case, the program found 1699 circles.
Search Lessons
1. Use the tools at hand to get a quick overview. In our case, using Google Earth’s ruler tool let us find that the center-pivot systems in Saudi Arabia are metric. That seems obvious in retrospect, but it leaps out at you when you compare it with US fields.
…. but don’t stop with the simple tools…
2. Learn what tools are available to you… even more sophisticated ones. In this week, we see that some programming is incredibly handy to know. In truth, you didn’t need to know much (other than copy-and-paste), but just have an inclination to tinker with the code to figure out what would work.
In general, learning to code is a great thing to do, if only because you’ll now know how to create your own tools (or at least, you’ll know how to adapt the tools that are already out there for you).
In this case I happened to know that “circle finders” were a thing–a tool I could probably use to help solve this problem. (Did you know this?)
One obvious one in this category might be something to convert scanned text (e.g., text captured in a picture) into searchable text. You can imagine when such a thing would be handy.
What other kinds of tools are out there like this?
The more you know, the more robust your SearchResearch skills.
Search on!