Fog is a thick cloud of tiny water droplets…
… suspended in the air near the ground, reducing visibility to less than 1km. That’s the technical definition.
But, as many SearchResearchers found out, sometimes it’s something more than just water droplets.
Our challenges this week were:
1. What’s the story with the fog in London? IS London foggy? Or was it only foggy in literature? Why does London have this reputation?
2. As a kid, I lived near Long Beach, California and I remember great fogs. But I don’t see them much anymore when I visit these days. Have the fogs of my youth (the 1960s) vanished? Is my memory wrong? Do they still have fog as often as we did when I was a kid?
Like most SearchResearchers, I fairly quickly learned that the great historic fogs of London weren’t really fog per se. My first search query was:
[ london fog ]
I was hoping to find some useful history about the fog, but I found that the results were completely swamped by commercial results about the London Fog clothing company. Ah well. This happens all the time–usually, you just add another term (that’s NOT clothing related) and the kinds of results you want will emerge.
My second query:
[ london fog history ]
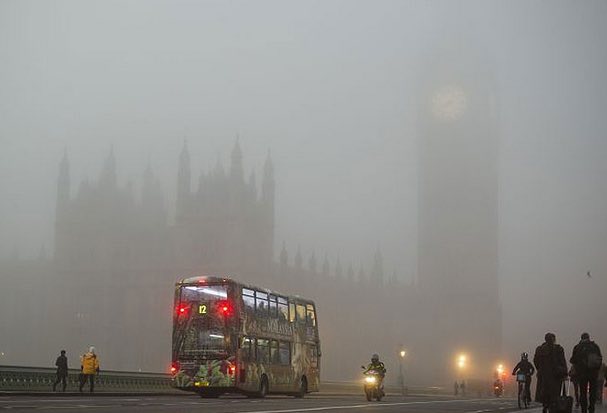
worked perfectly well. And that’s when I learned that the famous “pea soup” fog of London is only partly true fog. It really was a combination of smoke and other obnoxious particulate aerosols pumped into the air, making breathing (and life itself) difficult.
As the Wikipedia entry about The Great Smog of ’52 described it:
….it was a severe air-pollution event that affected London during December 1952. A period of cold weather, combined with an anticyclone and windless conditions, collected airborne pollutants mostly from the use of coal to form a thick layer of smog over the city. It lasted from Friday 5 December to Tuesday 9 December 1952, and then dispersed quickly after a change of weather.
Although it caused major disruption due to the effect on visibility, and even penetrated indoor areas, it was not thought to be a significant event at the time, with London having experienced many smog events in the past, so-called “pea soupers”. Government medical reports in the following weeks estimated that until 8 December 4,000 people had died prematurely and 100,000 more were made ill because of the smog’s effects on the human respiratory tract. More recent research suggests that the total number of fatalities was considerably greater, at about 12,000…
While this article is about the Fog/Smog of 1952, it suggests that the pea-soup fogs of earlier times were just as bad, possibly worse, and due to the same causes.
 |
| London Smog/Fog, Dec 1952. Daily Mail |
An article from the Daily Mail (UK) described it like this:
The city [London] had been paralysed by swirling fogs since the Napoleonic era, 150 years earlier. By the time Dickens came to write about them, he imagined dinosaurs stalking out of the mists. Readers of Sherlock Holmes cannot imagine the great detective without seeing him striding up Baker Street shrouded in eerie tendrils of fog.
I wanted to learn about those historic fogs, so my next query (to find the earlier fog events) was:
[ pea soup london fog ]
This led me to a fascinating article by the Environmental Protection Agency about the London fog/smogs.
Americans may think smog was invented in Los Angeles. Not so. In fact, a Londoner coined the term “smog” in 1905 to describe the city’s insidious combination of natural fog and coal smoke. By then, the phenomenon was part of London history, and dirty, acrid smoke-filled “pea-soupers” were as familiar to Londoners as Big Ben and Westminster Abbey.
The smog even invaded the world of Shakespeare, whose witches in Macbeth chant, “fair is foul, and foul is fair: Hover through the fog and filthy air.”
Smog in London predates Shakespeare by four centuries. Until the 12th century, most Londoners burned wood for fuel. But as the city grew and the forests shrank, wood became scarce and increasingly expensive. Large deposits of “sea-coal” off the northeast coast provided a cheap alternative. Soon, Londoners were burning the soft, bituminous coal to heat their homes and fuel their factories. Sea-coal was plentiful, but it didn’t burn efficiently. A lot of its energy was spent making smoke, not heat. Coal smoke drifting through thousands of London chimneys combined with clean natural fog to make smog. If the weather conditions were right, it would last for days.
Early on, no one had the scientific tools to correlate smog with adverse health effects, but complaints about the smoky air as an annoyance date back to at least 1272, when King Edward I, on the urging of important noblemen and clerics, banned the burning of sea-coal. Anyone caught burning or selling the stuff was to be tortured or executed. The first offender caught was summarily put to death. This deterred nobody. Of necessity, citizens continued to burn sea-coal in violation of the law, which required the burning of wood few could afford.
So it’s clear that the fog of the Victorians (and Holmes) were truly viscious smogs that predate those fine days of yesteryear. And while people might complain about EPA regulations today, nobody can dispute that the smog in LA today is MUCH less than when I was growing up (yes, in Compton) in the 1950s. And the EPA doesn’t torture or execute anyone.
Moral of that story: Be careful what you burn; it ends up in the air AND your lungs. Another moral: Environmental laws work only if you have enforcement.
So what about Long Beach?
I immediately started looking around for weather/climate data for the Long Beach airport.
My query:
[ long beach airport climate data ]
led me to many resources, but most of them only had data for the past few weeks, or maybe a year or two. The problem was how to find longitudinal data. Luckily, I found two of them (mostly by just clicking on all of the results until I found good, long-term data).
Here’s one chart I created from WeatherSpark’s data set. Here, I’ve collected a number of charts over the years, illustrating how many days were foggy.
It certainly looks like there were more fog events in the past than nowadays.
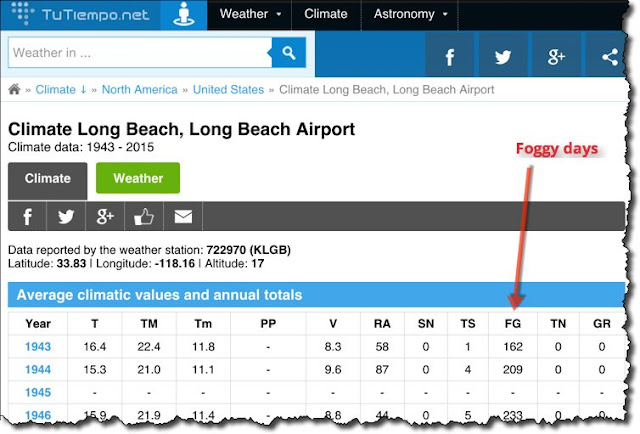
But, like Ramón, I also found an excellent weather/climate historical data site: TuTiempo.net, which gives lovely data tables going back many years. Here’s the data table for Long Beach airport, which conveniently breaks out “foggy days” into its own column
A bonanza!
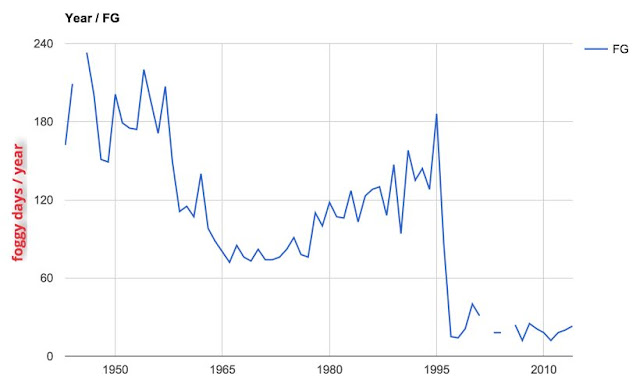
I pulled the data from this table and created the following chart:
 |
| Data from TuTiempo.net – charted by Dan. Gaps in the line are gaps in the data set. |
It certainly seems that the total number of foggy Long Beach days fell precipitously around 1995-1996. (But I have to admit that a sudden drop like that LOOKS like a change in the way one measures the foggy days, rather than as an actual decline. With more time, I’d dig into how they measured the data, and whether or not the method changed in the mid 1990s.)
Regardless, the difference in foggy days between my youth (1955 onwards) and today seems fairly impressive.
So I too did a more general search for mechanisms that might cause fewer foggy days. My query
[ California fog decline ]
and I found a number of articles documenting a general decline in the number of foggy days along the California coast. Fog has declined in the past century along the California coast discusses a loss of fog along the northern California coast: “The data support the idea that Northern California coastal fog has decreased in connection with a decline in the coast-inland temperature gradient and weakening of the summer temperature inversion,” Johnstone said.
Other scientific papers describe the change in fog further south, down in Long Beach. More urban heat, less summer fog tells me that the urban heat island effect – caused by concrete and asphalt retaining heat during the day and warming up the nights – is pushing up the moist coastal cloud layer. That turns what was once misty fog into a cloud layer that does not touch the ground.
So it’s pretty clear: My memory is right. It was foggier back then.
Search Lessons: As usual, it’s always good to get a couple of different KINDS of evidence. Data from multiple sources, as well as articles about the topic (from reputable journals and authors) that are all pointing in the same direction… well, that’s convincing.
And real data, in the form of data tables, is wonderful. You can confirm the trends yourself!
Search on!


